When does this Bitcoin sideways accumulation end?
Bitcoin in 2022, has been a series of dumps followed by a series of Bart Simpson patterns (BTC climbs up only to fall to the original price on the chart). We will look at when this might end. To do that we must review the similarity to the Bitcoin chart compared to the classic Wykoff accumulation pattern:

The similarities in the above chart are striking. However, that does not tell us when Bitcoin will make a move.
The next chart shows a classic double bottom at the end of a bear market correction pattern:

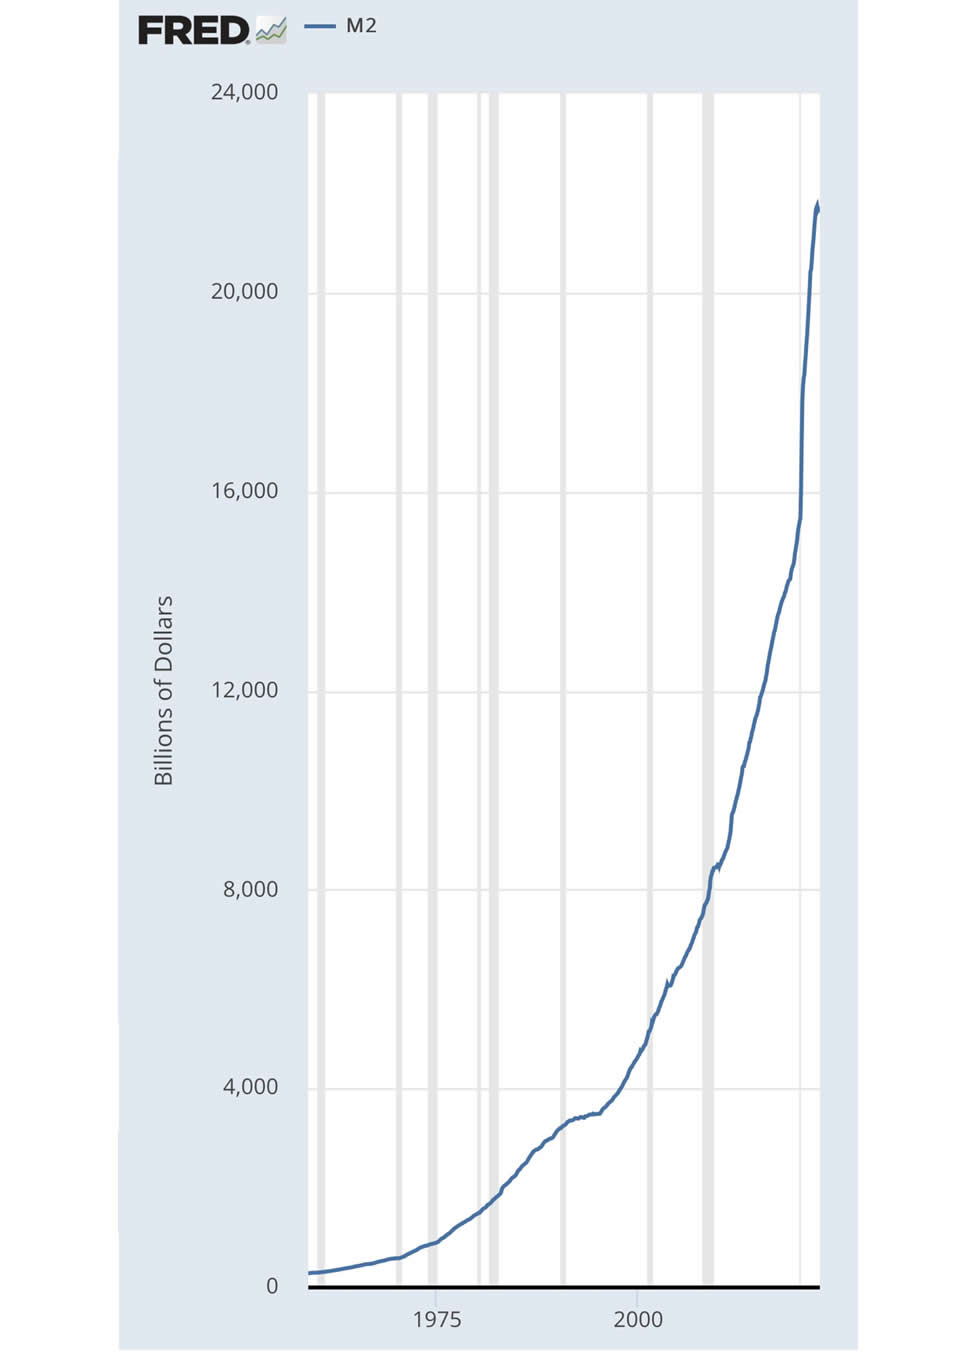
In the above chart, the comparison is Bitcoin in 2022 compared to the Nasdaq in 1995. Since Bitcoin is an inflation hedge we also have to look at the source of inflation and project that out into the future. First off is M2 Money supply. This next chart is M2 money supply since 1960:

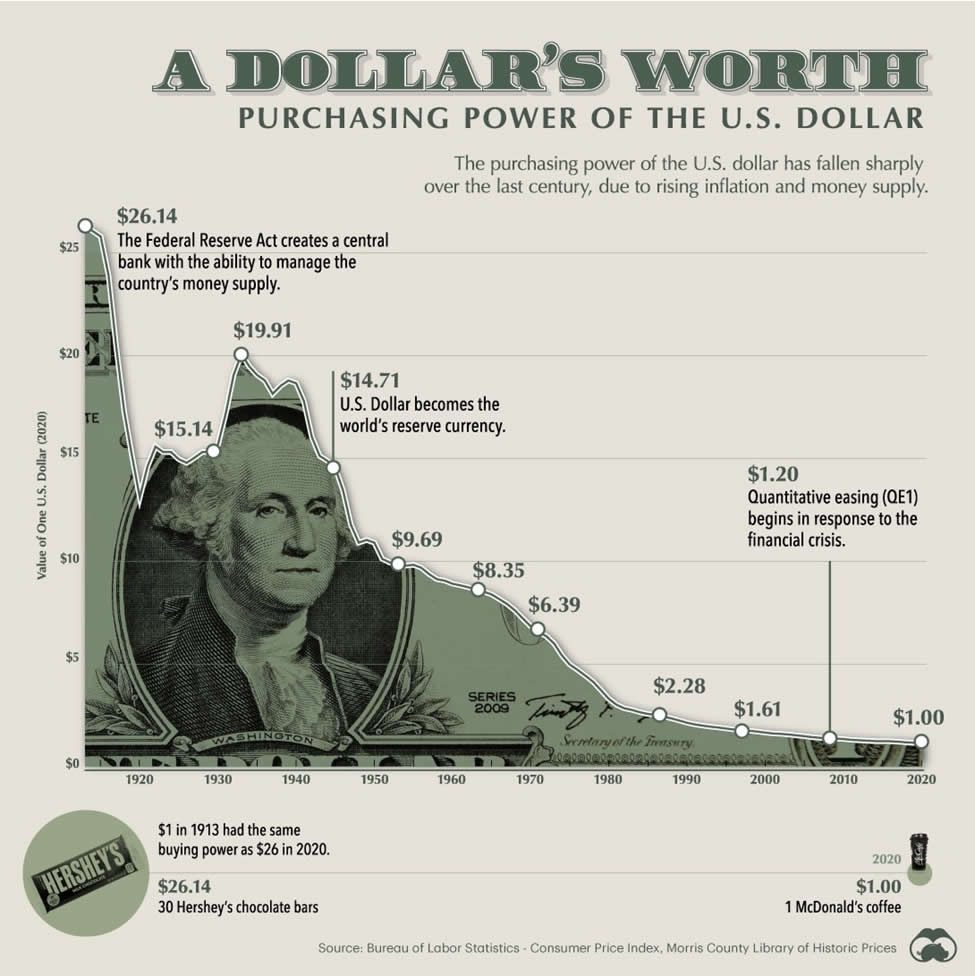
Money supply started really trending up in 1971, when President Nixon took the US off the Gold standard, and ever since, he let the US dollar float with no backing asset. Back then, the US even defaulted on the Gold it owed France. Instead of giving France their Gold back, Nixon eliminated the Gold standard and kept the Gold. It was supposed to be temporary and it has been 51 years now! This next chart shows that what one could buy with $1 in 1913, which now takes $26.14 as of 2020.

We have already shown how there is really no way for the Fed to control inflation. The Federal Funds rate would have to be in the range of 30% to stop inflation. An FFR rate that high would destroy the global economy. There is no way for the Fed to tame inflation. All they can do is make it look like they are trying to control it. We can see how it may last until 2023 before the Fed slows down the rate hikes, maybe well into 2023. They will have to drop rates at some point. There is no way to see when that will be. They are obviously on a limited run way with the rate hikes. This next rate hike will likely be smaller than the July hike. We have heard 50 to 75 bps. Time will tell. Here is a rate hike projection while showing the FFR projections into late 2023:

This will NOT tame inflation. It is only a veiled attempt to make it look like an attempt. The level of national debt is exponentially higher than the Paul Volker days of the 70’s and 80’s. Back then, debt to GDP was 30%, today it is nearing 130%. If the above chart projections are close to accurate. Then, the DXY chart will begin falling off as the rate hikes are frozen next year. This above projection is for only one rate hike of 25 bps in 2023. If that does happen the DXY will roll over. It is hitting major resistance at 109-110 now. Experts are saying the DXY either rolls over very soon, or it explodes to 120:

We really don’t know what the DXY will do. We just know that when it does roll over, Bitcoin will move up fast. The best predictive chart for Bitcoin is a what Steve Courtney puts up, the bearish engulfing candle which officially printed midnight 8/31/22. Typically, a monthly candle that engulfs a previous months bullish candle, then gets confirmed the next month. That means 60 to 120 days, or even more of bearish monthly candles. This coincides with rate hikes slowing in 2023, and rate cuts in late 2023, as was projected in the above Charlie Bilello chart. So, based on this chart here:

We don’t expect much bullish price action the rest of this year. Bitcoin might hit $30K, but could fall back into the low $20’s again. 2023, especially the second half is when we expect more significant price gains. We need to remain patient. We will add that as we expect Bitcoin to start breaking out next year. We also expect stocks to crash late this year again and throughout 2023. Real estate will follow stocks and we expect the recession we are now in, to deepen throughout next year. All this, while inflation is galloping out of control! Remember, the strategic petroleum reserve which has been drained daily all year, is set to stop being drained in November. At that point, expect Crude Oil and Nat Gas prices to explode up. Energy prices drive inflation! When this happens in earnest, whenever that is, rates may start dropping then. Could be 9 months from now. At that point, Bitcoin, Land, Gold, Silver and Art will be the main hard assets to own. Those who own them will survive this incoming recession/ depression. Those who do not WILL be wiped out! We are not kidding. This is going to be serious. We cannot predict when this tsunami of inflation and stock crashes will come ashore, only that it will happen and now is the time to get ready! We are not financial advisors and this is not financial advise. We only have to be right once! No sense in worrying about exact timing. The storm is coming, prepare before it hits!
Neutral ATM is here to get everyone off of zero Bitcoin.
Give Neutral ATM a try. We have low rates, convenient locations and we are expanding. Contact Neutral ATM, we will answer all your questions about Bitcoin and using our ATM machines. Find a Neutral ATM Bitcoin machine location near you.
