Looking Deeper at the Bitcoin Squeeze
We have more time today to look into the details of why there is a squeeze in opposite directions, pulling against Bitcoin. The miner accumulation is coming back. The green on this chart below, shows positive miner net position in Bitcoin. This is a positive development for future price action:

Miner capitulation drags the price down, miner accumulation ultimately pushes it up. This next chart is the stock to flow heat map. Again, we can see the supply squeeze affect on this chart with the first top in April and now ascending towards the second top above the blue line, which levels off at $100K. Stock to flow measures stock of Bitcoin available to buy to the flow of Bitcoin being bought up and accumulated. After the halving when Bitcoin gets tight, stock is down, which kicks off more accumulation, and price action always follows. Here is the chart:

The pull in the opposite direction, presently, is the DXY. As the US Dollar index (DXY) moves up (due to China Evergrande sending investment money to the USD), this is a negative drag on Bitcoin price action. They are reciprocal indicators. DXY being strong will drag down Bitcoin every time. Bitcoin is a hedge. Here is the latest DXY chart:

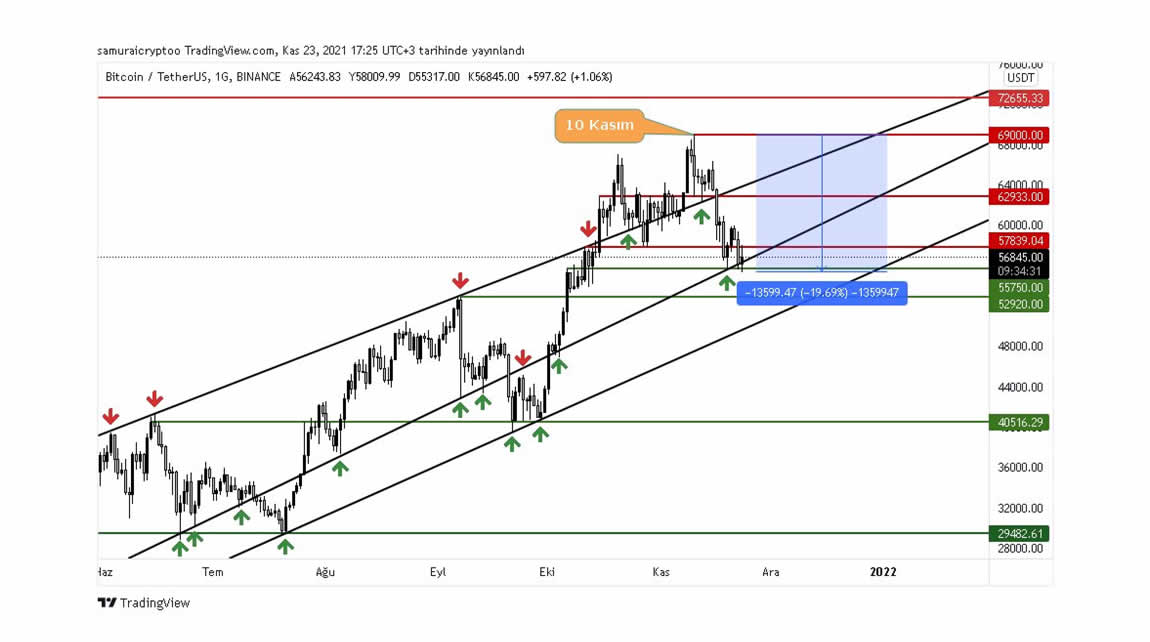
Notice the orange pointer to the bottom where the DXY pivoted back up. Then, see the orange pointer in the next chart at the $69K Bitcoin top where price action pivoted down. DXY has been up since then. This explains why Bitcoin cannot break the 1.618 fibonacci level. If the DXY pivots, that gives Bitcoin the green light to rise above the 1.618 fib level and make it support, not resistance! See this chart below:

This last chart shows the two Fibonacci levels Bitcoin has been ranging in. The 1.272 and the 1.618 fib levels. These are all interconnected. Global Macro supercedes technical analysis but they do relate to each other. We see global macro as the deciding factor, technical analysis just gives us clues as to where Bitcoin is. Global macro says where it’s going. The supply demand (ie. Stock to flow diagram) is a global macro construct. Only a truly scarce asset can be measured on a stock to flow chart. No asset is as truly scarce as Bitcoin due to the halving of the miner reward every 4 years. Therefore, Bitcoin 4 year cycles are predictable and they rhyme. We have pointed out this rhythim over and over again. Now, in order for Bitcoin to hit it’s predicted parabolic turn up, it has to make the 1.618 fibonacci level support, not resistance. Here is the chart showing this:

What is keeping this from happening up to this point? The DXY chart. A strong dollar, hurts Bitcoin, a weak dollar helps Bitcoin. That’s why it is the best hedge in the world. The weakness/strength of the dollar is caused by bond yields, inflation, deflation, and events such as a major bankruptcy, or a stock market crash. China Evergrande is such an event. It is pulling against Bitcoin while stock to flow pulls the opposite way. Something has to give. Tension is building! Bitcoin will need to pull out of this, and the DXY pivoting back down is the rocket fuel. What might cause this to happen? QE and more printing now that the $1.8 trillion infrastructure package was signed. This also explains why timing is impossible to predict. Hurry up and wait. So, watch the DXY chart and watch the 1.618 finacci level on the Bitcoin chart. They are connected for now. Something has to give, Bitcoin is at a crossroads! Its only a matter of time.
Neutral ATM buys and sells Bitcoin as little as $20 at a time! You do NOT have to buy an entire Bitcoin. Neutral ATM is here to get everyone off of zero Bitcoin.
Give Neutral ATM a try. We have low rates, convenient locations and we are expanding. Contact Neutral ATM, we will answer all your questions about Bitcoin and using our ATM machines. Find a Neutral ATM Bitcoin machine location near you.
