Bitcoin is Still Consolidating, Change Your Investing Habits. Part Two
We know this much. When, not if, when Bitcoin breaks $20,000 and holds it as support. It will be fireworks. However, Bitcoin is at a 92 currently on the fear and greed index. It has run up a lot, especially since early October. We look long term and never deviate from that strategy. We are not short term traders. A major buy signal flashed today, yet massive resistance is above the $19,000 price range Bitcoin has stayed in for a week now. Short term it may very well pull back again like on Thanksgiving. This one could be worse than Thanksgiving. Irrelevant. If you look long term, Bitcoin will stay above the 21 week moving average and wants it proves support at that level it will charge back towards $20,000. So, short term we see a pull back. Long term, we don’t care, we are holding anyway. We know Bitcoin will bounce off the 21 day moving average ($13,000 - $14,500). We will get ready to buy the dip when or if it does happen. Once Bitcoin clears $20,000. That will be an exciting time. Look at these yearly candles for a perspective on bull markets. 2020 is the pre bull market year. 2021 will really show the major growth.

See how there are usually 3 or even 4 green candles until a red candle shows up on the yearly chart:

We are continuing to preach patience and resilience. Bitcoin is coiling up, even a large retracement down to $13,000 is only giving it room to strike up like a rattlesnake! Sorry, we are from Texas. Bitcoin does this every bull market. Stay patient. But be ready for a larger pull back, possibly this weekend!
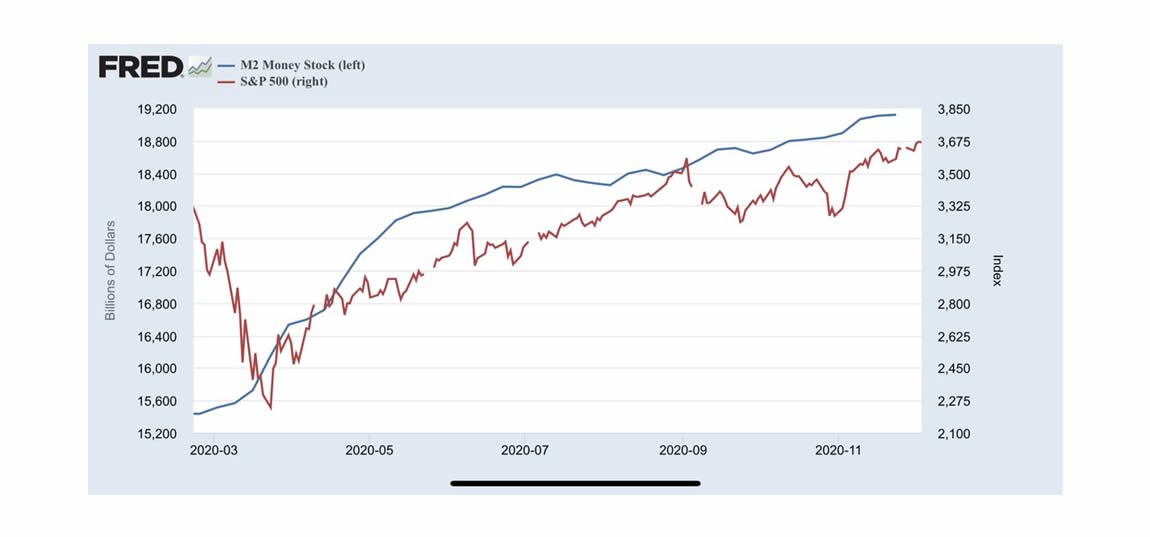
The next chart compares M2 money supply to the SPX. We are expecting more liquidity with this upcoming stimulus in congress. It sounds like it will come in under $1 Trillion. Janet Yellen called that a “down payment”. Here is the chart:

The US Dollar index (DXY) is still down and dropping in the mid 90 range now. It will continue down unless or until a major deleveraging event begins. With Money supply remaining so high, the markets remain propped up. It would appear the deleveraging event will get kicked like a can down the road. It will raise its ugly head at some point. As long as Bitcoin is still in its supply shock induced bull run as we have been discussing, a deleveraging event may not slow it down for very long. It is easier to predict when the bull market will end in Bitcoin, than when a stock market deleveraging event will take place.
Even more longterm, look at this next chart comparing the Bitcoin adoption curve to that of the internet, online payment systems, and mobile phones. Bitcoin is the fastest adoption curve of them all. The volatility of Bitcoin since 2009 has already slowed down some, and that will continue over the next 10 years plus. See the adoption curve chart:
This leaves little doubt that when Bitcoin nears the end of this adoption curve in 2030 or 2040, the price discovery will be at a level few can imagine today. Similar to Apple in the 80’s or Amazon, Microsoft in the 90’s. We have mentioned a laddered selling approach. This bull market will last a year, maybe more. That time will be spent thinking about and considering how much Bitcoin from the portfolio should be sold near the top. That is a hard decision. Withstanding a pull back should not be. Neutral ATM is here to get everyone off of zero Bitcoin.
Give Neutral ATM a try. We have low rates, convenient locations and we are expanding. Contact Neutral ATM, we will answer all your questions about Bitcoin and using our ATM machines. Find a Neutral ATM Bitcoin machine location near you.
