Bitcoin Bull Market is coming, can you hear it?
The national debt is now over $29 trillion, the vote just passed the US congress and senate to raise the debt ceiling by $2.5 trillion. The bond market is bloated to $33 trillion (It did not exist before 1982). CPI inflation is now 6.8%, and wage growth in the US now averages 4.8%.
To top it all off, the US Fed just announced that $30 Billion per month will be tapered. 3 rate hikes in 2022 and 3 more in 2023. Higher rates will gut the economy, click here to view on twitter.
NIRP appears never ending as this next chart demonstrates. Long Bond rates are going negative when CPI is factored in. Rate hikes to stem that in 2022 and 2023 will drag down stocks and real estate prices. It may take two years to fully play out. Here is the chart below:

When the red line is high (bond market debt) and the black line is low (long term bond rates). That is bad, thus the tapering and rate hikes for 2022, and 2023.
Now long term, what impact will this have?
Before we answer that, this next chart is pretty funny. The Bank of England has said Bitcoin could go to zero. This chart below is the British pound priced in Bitcoin:

Another funny chart, but not really. IS China property giants and their crashing stocks. The US bond market is $33 trillion. Yet these China real estate giants stocks, are tanking! China Evergrande is a $300 Billion bankruptcy. They have missed their bond payments and defaulted! This will not end well:

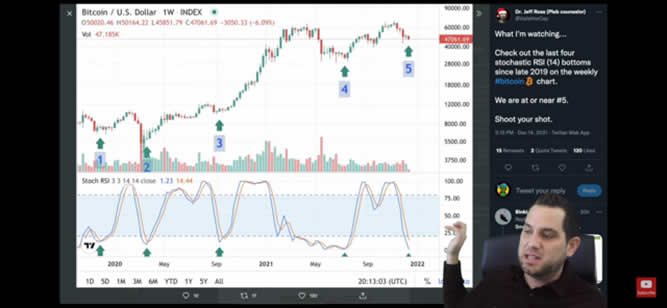
It is hard to predict timing of events, we won’t even try. Just to say that there will be risk for the bond market going forward. The spillover for China Evergrande has not been felt yet, nor has the affect of these higher bond rates over the next two years. We keep saying, one of the only safe haven assets for scared money after these symptoms we are seeing wreak their havoc, is Bitcoin. The RSI in this chart below is oversold. Historically, oversold RSI is a bottom feature and price action goes up from there:

In the weekly chart for Bitcoin, it is looking similar to March 2020, when it bounced off the 200 day moving average and went on a long run. Could that be in the cards for next year? At least for the first quarter. That is how we see it. Time will tell. Here is the chart below:

Note the purple line below in this chart. The RSI (relative strength index) bottoming and reversing course is what we are looking for. To be ready for this one has to accumulate as much Bitcoin as possible and wait. We believe this is a winning strategy and has paid off for us. This is not financial advise, we are just explaining the true strength of Bitcoin as a store of value.
Neutral ATM buys and sells Bitcoin as little as $20 at a time! You do NOT have to buy an entire Bitcoin. Neutral ATM is here to get everyone off of zero Bitcoin.
Give Neutral ATM a try. We have low rates, convenient locations and we are expanding. Contact Neutral ATM, we will answer all your questions about Bitcoin and using our ATM machines. Find a Neutral ATM Bitcoin machine location near you.
