Bitcoin Bounce Incoming, Wait for it!
Today we will mix global macro analysis with Bitcoin technical analysis. We already mentioned liquidating leveraged long positions as a reason this Bitcoin dip happened. From the global macro perspective. The sharp jump in the DXY index is another good reason. When the DXY (USD Index) goes up sharply, Bitcoin drops every time. This is happening largely because of fall out from the Evergrande collapse in China. Evergrande was the 3rd largest real estate developer in China and they defaulted on debts. It was 8.5X worse than Enron the biggest banckruptcy in US history. Money invested there has jumped into the USD, which drives the DXY up. There is a shortage of USD globally driving up the index and helping drive down the Bitcoin price. However, we know longterm that money will come into Bitcoin. We mentioned in the past months blogs, scared money runs to the USD first, then to Bitcoin, Gold, Silver, Ethereum. Here is the DXY chart below:

The value of money has been eroded by years of cheap interest rates, yielding low or negative rates for Bonds. View on twitter.
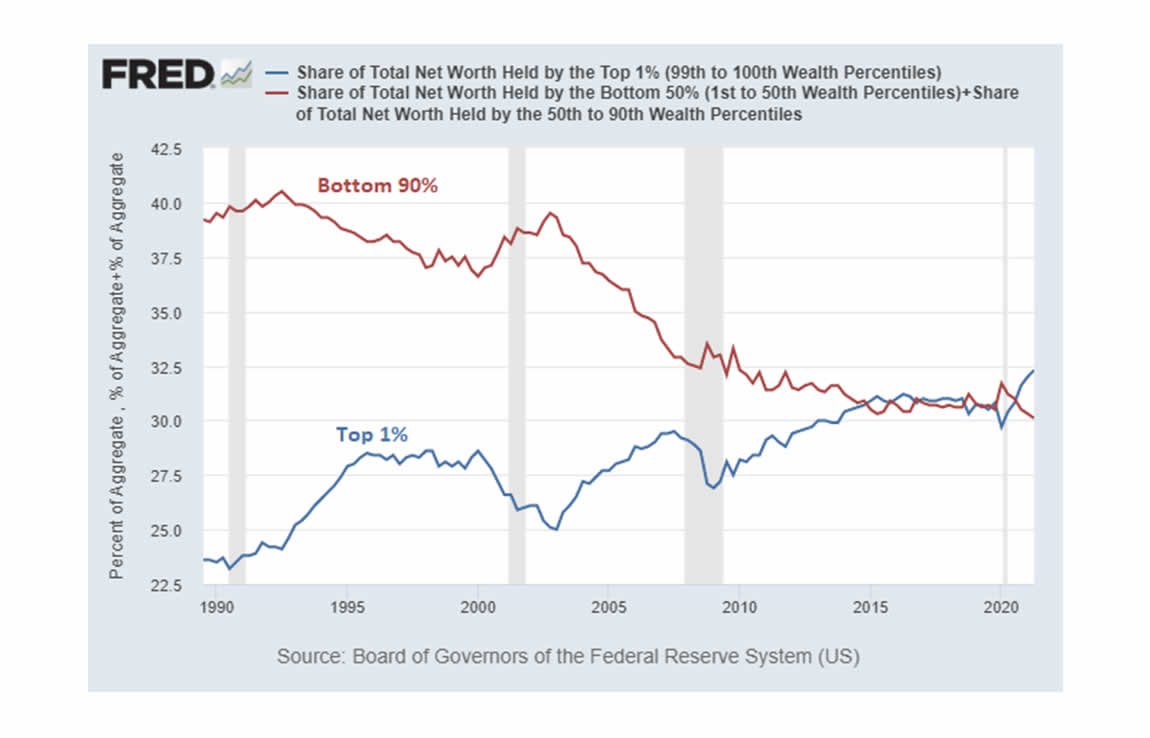
This next chart below from Lyn Alden, shows the bottom 90% by net worth in red, the top 1% by net worth in blue. This is for the US. The bottom 90% by net worth in the US have droped from 39% of the aggregate to 30% of the aggregate since 1990, while the top 1% by net worth grew from 23% by aggregate to 32.5% by aggregate, since 1990 to present. Quantitative Easing and low interest rates have really helped owners of real assets while those who own less real assets are seeing wealth erosion. Concentration of wealth is a real negative outcome of loose monetary policies (printing money, keeping bond yields low), not to mention inflation to goods and services. See the chart below:

Now, as we see the VIX and DXY indices rising fast, a prediction of a stock market crash in the 4th quarter appears reasonable. Perhaps it will take into 2022, although less likely. Either way, the global macro set up, is very condusive for a Bitcoin bull market and should keep demand for Bitcoin up. This dip Bitcoin is in now appears temporary, and the next two charts below show us why Bitcoin is poised for a big November/ December!
The first one is the channel Bitcoin is in. Notice the two red circles for the 2013 double top cycle. Then see the green circle as Bitcoin transitioned into parabolic to close out the year. That is the exact set up Bitcoin is in for 2021. The first two red circles and the green circle, halfway up the channel where we are finding resistance, is exactly what happened in 2013. How many times have we said Bitcoin rhymes??

This next chart is the RSI. Between 67 and 71.8 is a historic support and resistance channel for the RSI. This shows resistance at 71.8 RSI. That does not mean Bitcoin will drop far, or for long. It is a pause, a dip, but as long as it holds 67 RSI support. This will be a shortlived Bitcoin dip. Here is the chart below:

Dips during bull runs are healthy. Bear markets after bull runs are over are healthy too, although very unpopular. That will be a discussion in 2022 sometime. For now, buy this dip, it has lasted over a week. We plan to buy again tomorrow. The bull run is NOT over. Although this is NOT financial advise. Keep HODLing!
Neutral ATM buys and sells Bitcoin as little as $20 at a time! You do NOT have to buy an entire Bitcoin. Neutral ATM is here to get everyone off of zero Bitcoin.
Give Neutral ATM a try. We have low rates, convenient locations and we are expanding. Contact Neutral ATM, we will answer all your questions about Bitcoin and using our ATM machines. Find a Neutral ATM Bitcoin machine location near you.
